The Stats & Analytics section provides powerful insights into how users interact with your platform, allowing you to make data-driven decisions that improve content performance, user engagement, and business growth.
It serves as a central hub for monitoring key metrics such as user activity, content popularity, revenue trends, subscription behavior, and device usage.
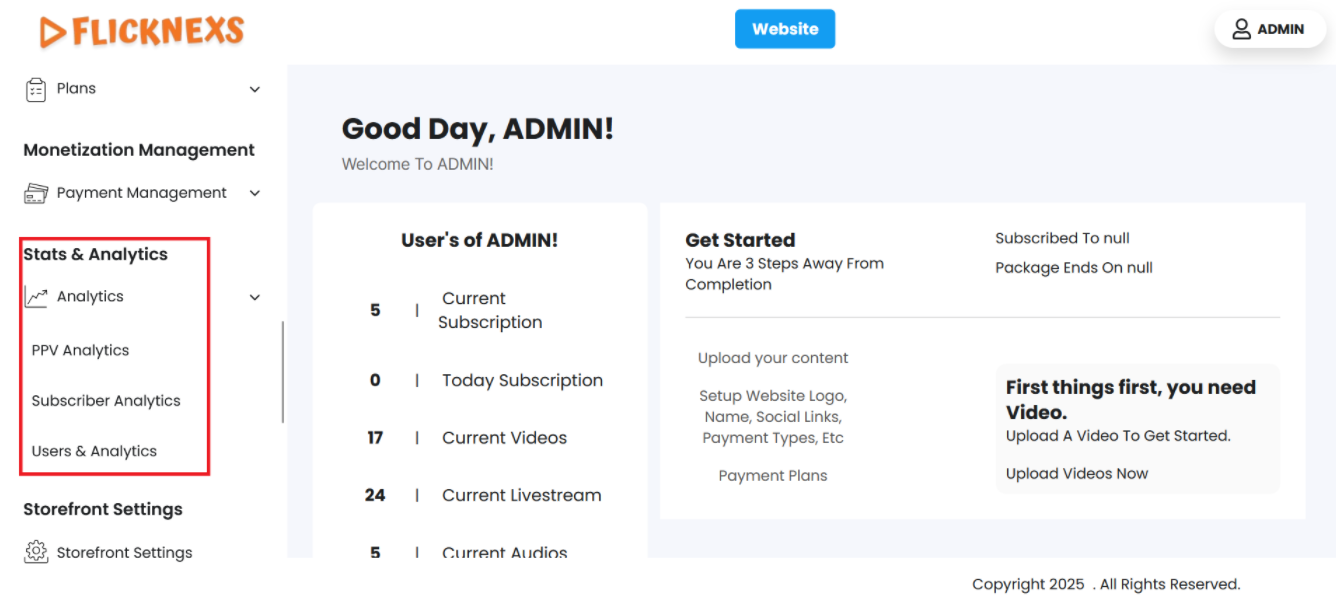
Analytics
Login to your admin panel and navigate to the Stats & Analytics in the side menu. You will find four options.
Follow these steps to manage ads:
- Access the Admin Panel: Log in to the Admin panel from your platform.
- Locate the Sidebar: On the left side of the page, you will see a sidebar containing multiple options.
- Select ‘Stats & Analytics’: From the sidebar, click on the ‘Analytics’ option.
- Navigate to the Stats & Analytics Section: After selecting ‘Stats & Analytics’, you will be directed to the Analytics section where you can find the analytics for the PPV, Subscriber, and User.
- To simplify your workflow, there is a ‘Search’ button at the top left corner of the table. You can mention specific variables to filter the entire data.
- In the top-right corner, you will find a ‘Reload’ button. Just in case you need the table to reflect the real-time data, you can use this button to refresh and display the information.
- You can export either one of the fields or all fields using the buttons – ‘Export’ and ‘Export all’. Under both the ‘Export’ buttons, you will find the following options:
- CSV
- XLSX
PPV Analytics
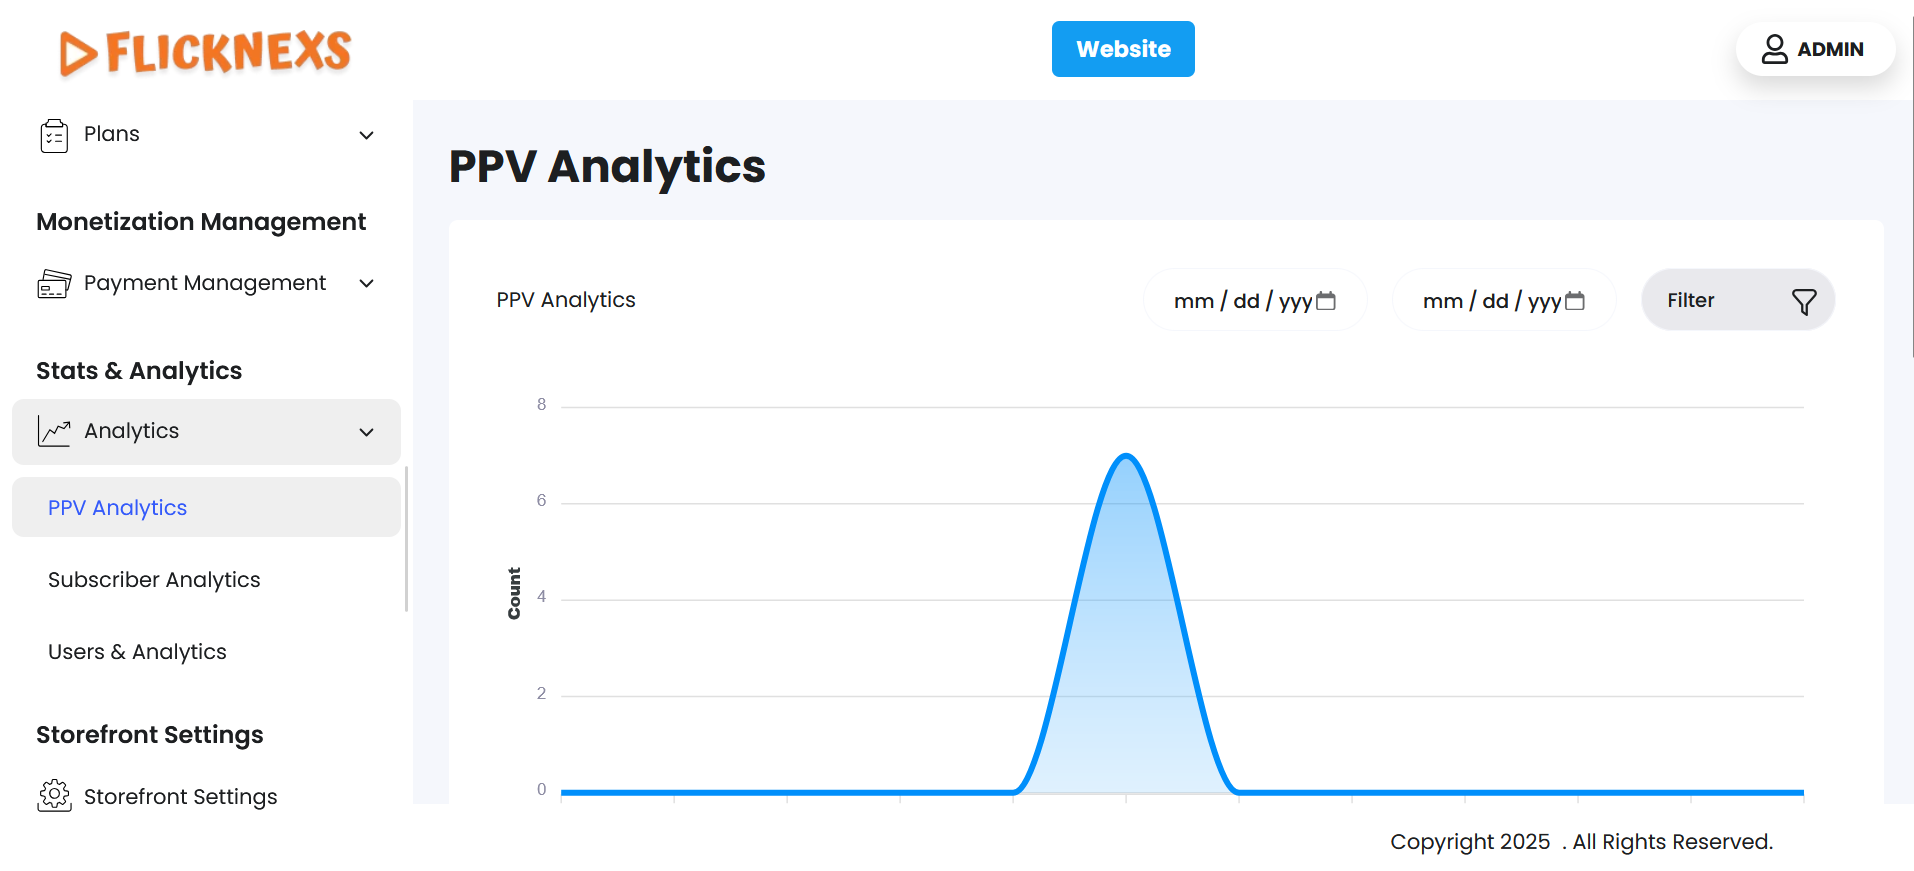
Navigate to the side menu, you will find ‘PPV Analytics’.
- Click on it and find data only related to the Pay-per-view monetization model.
- You will find a graph that shows the total number of PPV users by date and user count.
- To further simplify your search, just above the graph, you will find a date customization option. Just select the ‘from’ and ‘to’ dates and the panel will automatically reload the page to give you the desired data.
- Adjacent to the above, you will find ‘Filter’ with the following options:
- Last year
- Last month
- Last week
- Last 7 Days
- Yesterday
- Today
- This month
- This year
- Show ALL
Based on your requirement, you can find the data accordingly.
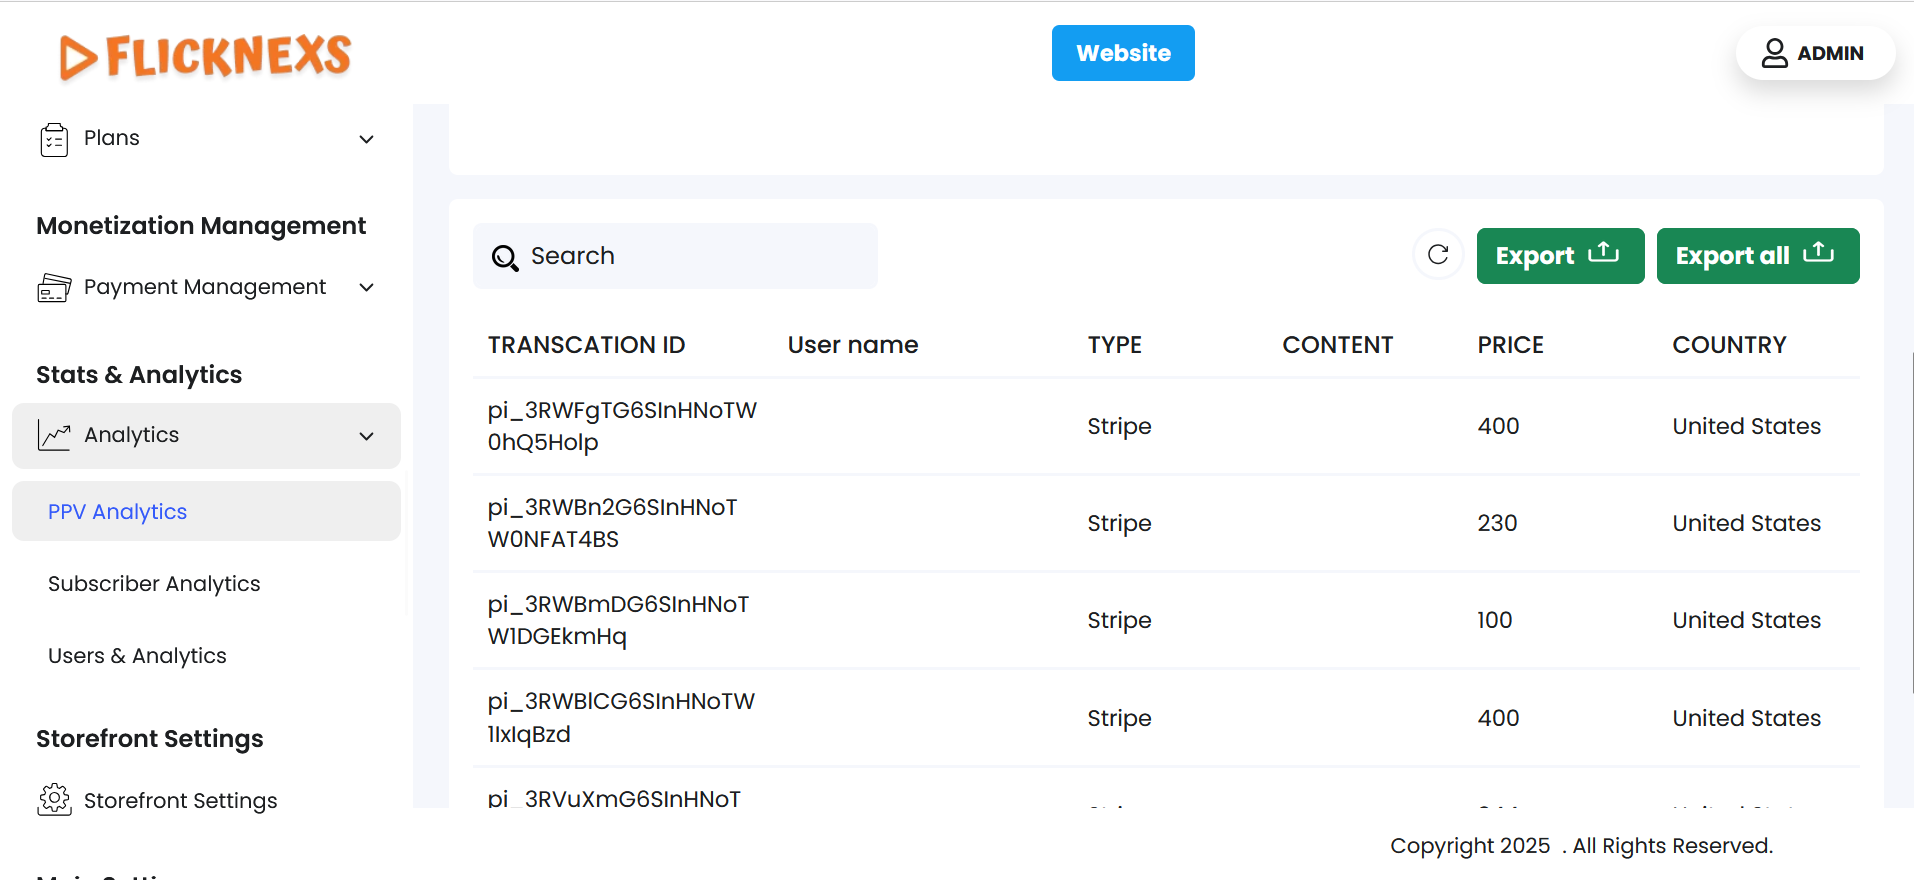
- Just below the graph, you will find individual details of the PPV model. The various columns include:
- Transaction ID
- User Name
- Type
- Content
- Price
- Country
- Timestamp
- Source
- To make your workflow more simple, there is a ‘Search’ option just above the table. You can search for any detail you require from the given columns of information.
- In the top-right corner, you will find a ‘Reload’ button. Just in case you need the table to reflect the real-time data, you can use this button to refresh and display the information.
- To make it convenient for analysis, you can export either one of the fields or all fields using the buttons – ‘Export’ and ‘Export all’. Under both the ‘Export’ buttons, you will find the following options:
- CSV
- XLSX
You can directly store the data in your desired location.
- At the bottom of the page, you will find a scrollbar to move between the various columns.
- Below that, you can select the page number you want to display.
Subscriber analytics
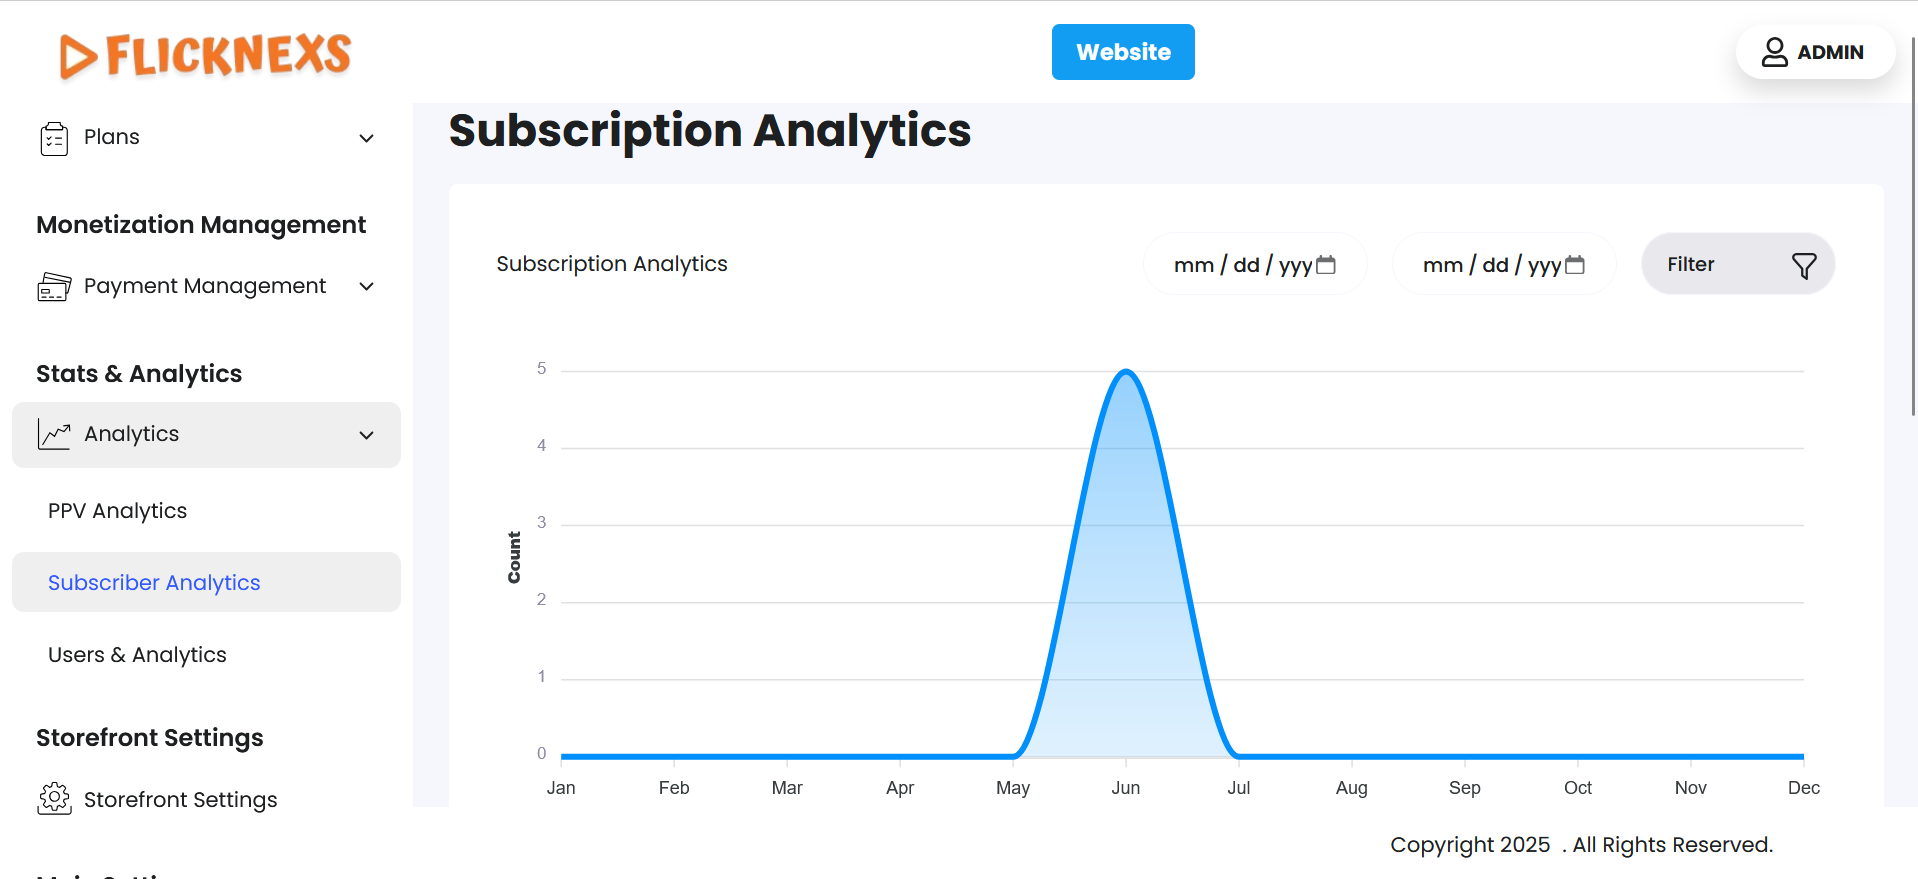
Navigate to the side menu, you will find ‘Subscriber Analytics’ just under ‘PPV Analytics‘.
- Click on it and find data only related to the Subscription based monetization model.
- You will find a graph that shows the total number of Subscription users by date and user count.
- To further simplify your search, just above the graph, you will find a date customization option. Just select the ‘from’ and ‘to’ dates and the panel will automatically reload the page to give you the desired data.
- Adjacent to the above, you will find ‘Filter’ with the following options:
- Last year
- Last month
- Last week
- Last 7 Days
- Yesterday
- Today
- This month
- This year
- Show ALL
Based on your requirement, you can find the data accordingly.
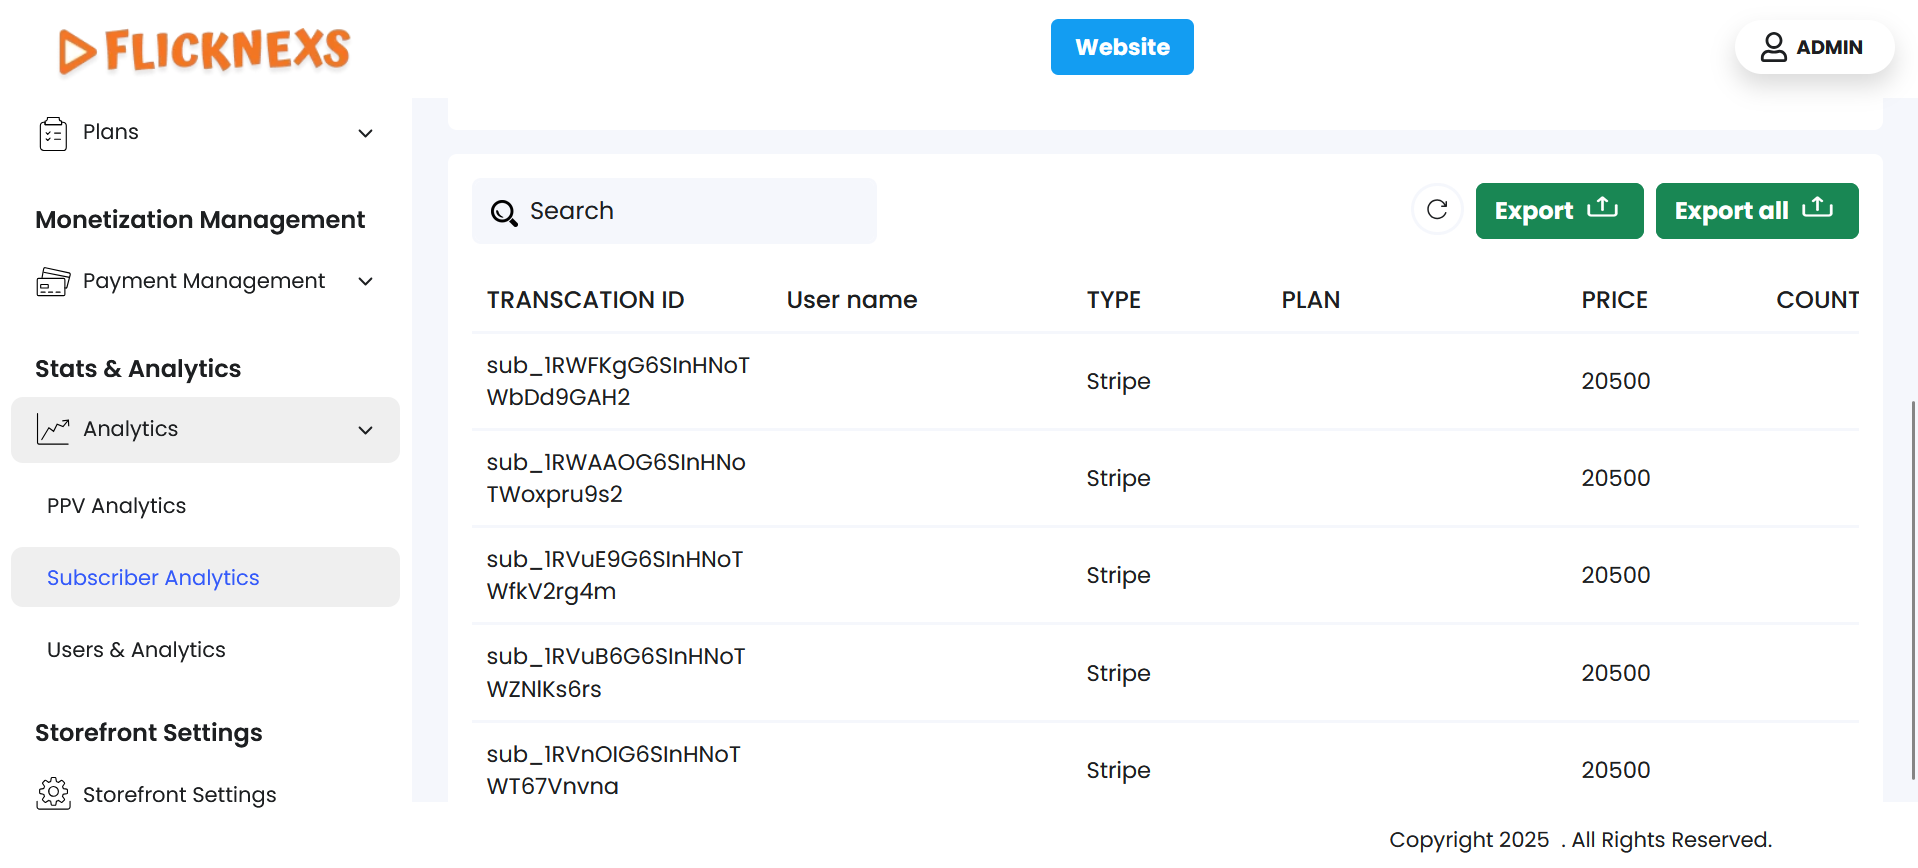
- Just below the graph, you will find individual details of the Subscription model. The various columns include:
- Transaction ID
- User Name
- Type
- Plan
- Price
- Country
- Timestamp
- To make your workflow more simple, there is a ‘Search’ option just above the table. You can search for any detail you require from the given columns of information.
- In the top-right corner, you will find a ‘Reload’ button. Just in case you need the table to reflect the real-time data, you can use this button to refresh and display the information.
- To make it convenient for analysis, you can export either one of the fields or all fields using the buttons – ‘Export’ and ‘Export all’. Under both the ‘Export’ buttons, you will find the following options:
- CSV
- XLSX
You can directly store the data in your desired location.
- At the bottom of the page, you will find a scrollbar to move between the various columns.
- Below that, you can select the page number you want to display.
Users & Analytics
Navigate to the side menu, you will find ‘Users & Analytics’ just under ‘Subscriber Analytics’. Click to view detailed analytics.
- You will find the types of users and the number of users under each type mentioned.
The various types of users are as follows:
- Registered: Total number of Users signed up to the platform.
- Subscribed: Total number of Users paid to consume the content.
- Admin: Total number of internal members accessing the platform for analytics.
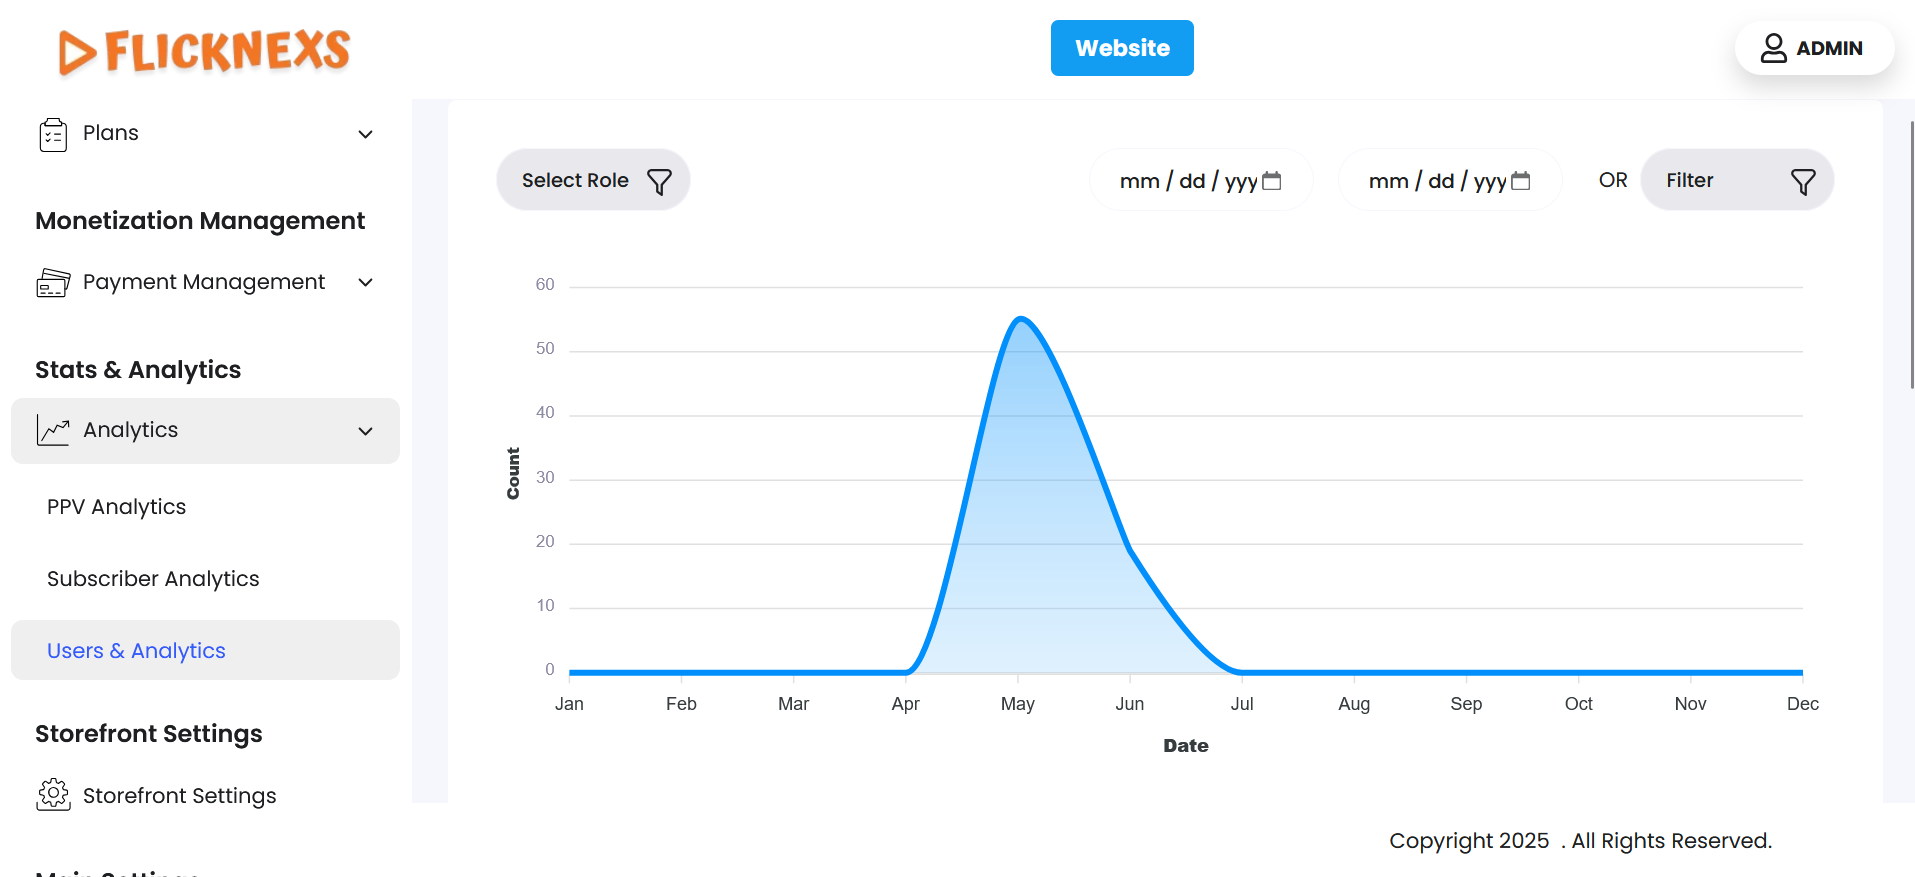
- Below that, you will find a graph that shows the total number of users that are inclusive of PPV, Subscription and Admin by date and user count.
- To further simplify your search, just above the graph, you will find a date customization option. Just select the ‘from’ and ‘to’ dates and the panel will automatically reload the page to give you the desired data.
- Adjacent to the above, you will find ‘Filter’ with the following options:
- Last year
- Last month
- Last week
- Last 7 Days
- Yesterday
- Today
- This month
- This year
- Show ALL
Based on your requirement, you can find the data accordingly.
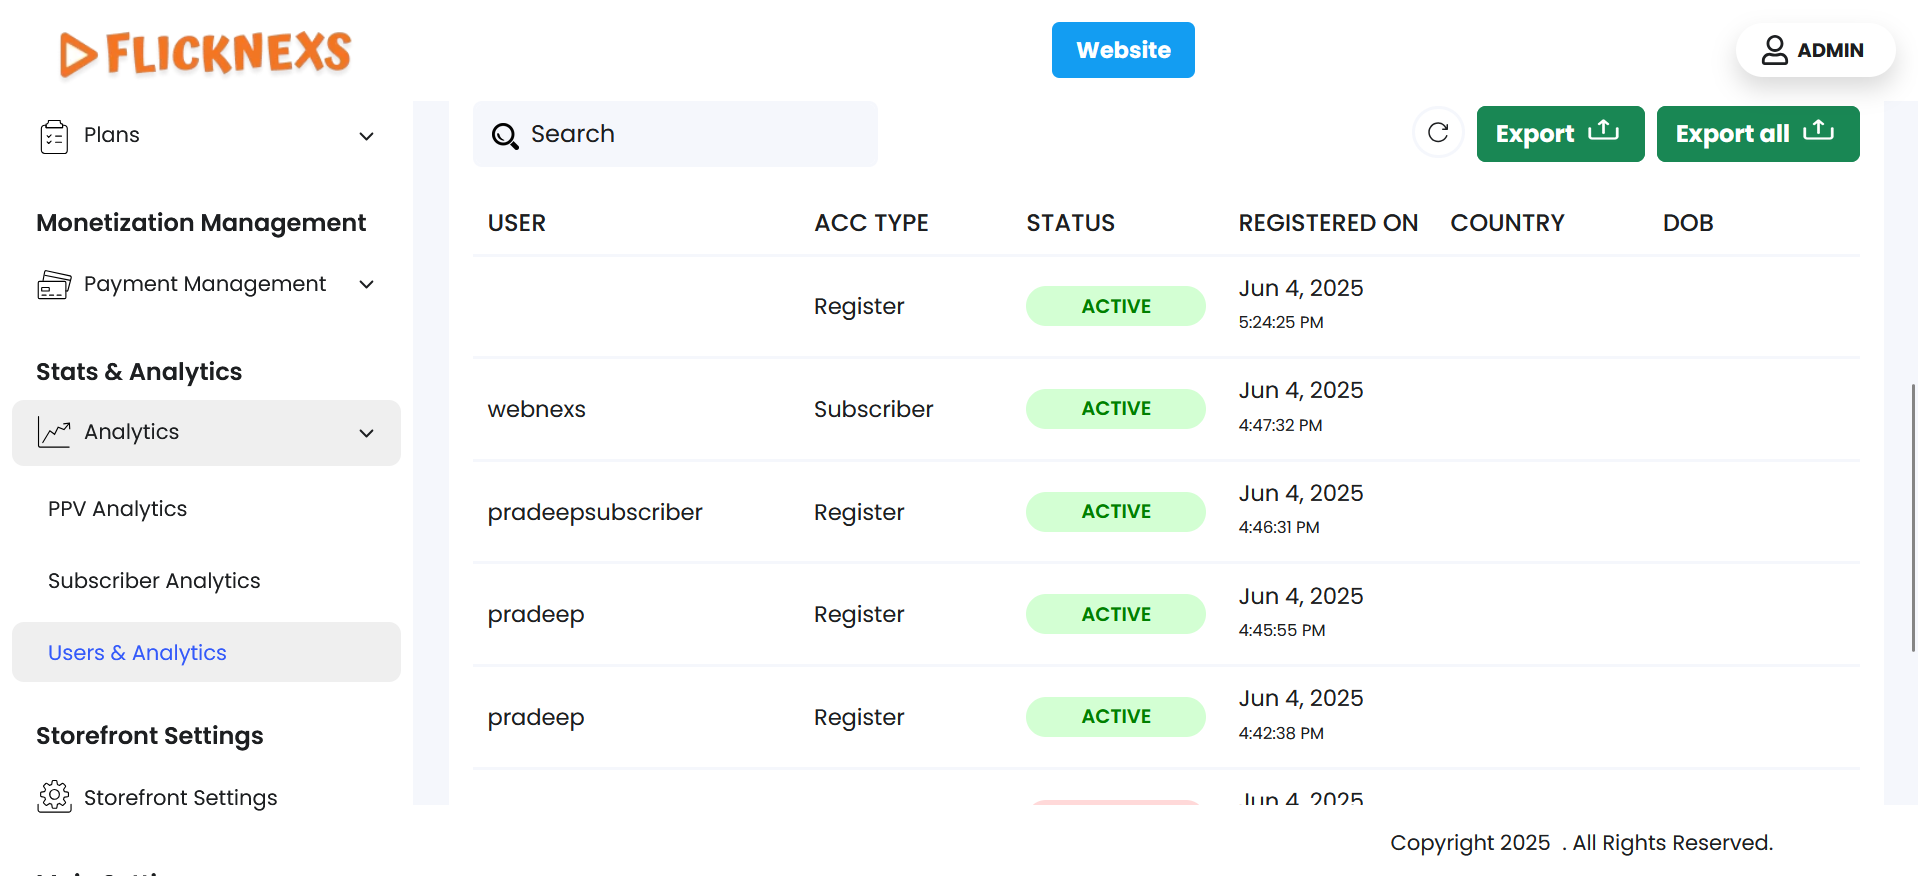
- Just below the graph, you will find individual details of your Users. The various columns include:
- User
- Acc Type
- Status
There are two scenarios, namely:
- Active: User has signed up and completed the verification step.
- Inactive: User has signed up and not completed the verification step.
Depending on each user case, the status will switch between the two.
- Registered On
- Country
- DOB
- To make your workflow more simple, there is a ‘Search’ option just above the table. You can search for any detail you require from the given columns of information.
- In the top-right corner, you will find a ‘Reload’ button. Just in case you need the table to reflect the real-time data, you can use this button to refresh and display the information.
- To make it convenient for analysis, you can export either one of the fields or all fields using the buttons – ‘Export’ and ‘Export all’. Under both the ‘Export’ buttons, you will find the following options:
- CSV
- XLSX
You can directly store the data in your desired location.
- At the bottom of the page, you will find a scrollbar to move between the various columns.
- Below that, you can select the page number you want to display.